|
|||||||||||||||||||||||
|
|
|||||||||||||||||||||||
|
|
|||||||||||||||||||||||
|
Chapter 6. Coordinate Systems |
|||||||||||||||||||||||
|
|
|||||||||||||||||||||||
|
|||||||||||||||||||||||
|
|
|||||||||||||||||||||||
|
|
|||||||||||||||||||||||
|
One of the greatest challenges of early explorers involved the process of determining their position on the earth. How do we measure position? Various methods can lead to the exact same location:
“I am in room 2312 (23rd floor) on the NE corner of 300 South 42nd St in NY.” “I am at latitude 40.30, longitude 73.60, and altitude 230 feet.”
These directions use dimensions such as latitude, longitude, altitude, street addresses, floors in buildings, etc. to describe relative positions. How would you describe the position of a thing in the room your currently in? What kind of reference point would you use? Man has created many types of maps and instruments to determine position, yet such questions gave way to a dramatic solution proposed in the early 1600s by Rene Descartes when he established the coordinate system that we refer to as the "Cartesian coordinate system" in his honor. His work established the foundations of analytical geometry; it connected algebra with geometry and paved the way for the discovery of many other mathematical concepts including calculus. |
|||||||||||||||||||||||
|
|
|||||||||||||||||||||||
|
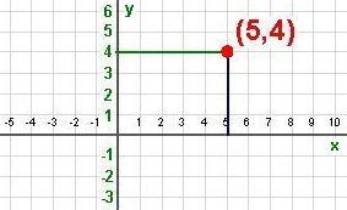
To describe a position in a plane, Descartes took two number lines and placed them perpendicular to each other. The position of a thing in this plane could then be represented as an ordered pair of numbers were the first number gives the horizontal distance from a specific reference point, a point of origin, and the second number gives the vertical distance from that same point of origin. In order to get from the origin to the point (5,4) we would move 5 units to the right and then 4 units up. We usually call the horizontal axis the x-axis and the vertical axis the y-axis.
|
|||||||||||||||||||||||
|
|
|||||||||||||||||||||||
|
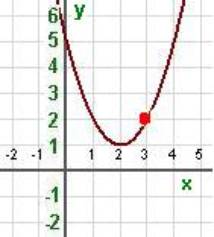
We can use a Cartesian coordinate system to represent a mathematical expression f(x) of a variable x by moving along the x coordinate and plotting all points (x, y) where y=f(x). The example above gives a visual representation of the expression x2-4*x+5. Imagine that you are a small ant crawling along the x-axis and the expression x2-4*x+5 represents a hammock hanging above you. If you start at the point x=0 on the x-axis, the hammock is 5 units above you. As you move to the right, the hammock starts to come down so that when you reach the point x=1 the hammock is 2 units above you. When you reach x=2, the hammock is 1 unit above you and it has bottomed out; it now starts to increase. At the point x=3 the y value is back up to 2. The points listed above lie on the plot as indicated for the (3,2). All such points trace out a curve that represents the height of the hammock above you in the 2-dimensional plane. Such a plot created a hyperbolic shape.
|
|||||||||||||||||||||||
|
|
|||||||||||||||||||||||
|
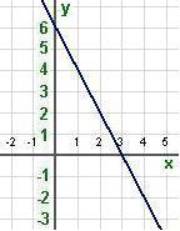
Basic shapes in geometry such as lines, circles, and angles have visual representations in the Cartesian coordinate system. For example the line drawn above goes through the two points (0,6) and (3,0). If one of the x value or y value equals 0, we call the point an intercept since the line intercepts an axis at that point.
|
|||||||||||||||||||||||
|
|
|||||||||||||||||||||||
|
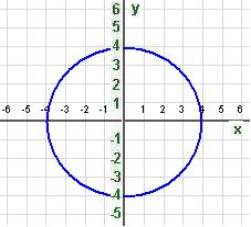
A circle shape corresponds to the above equation where the point (h,k) is the center of the circle and r is the radius. This example has a center of (0,0) and a radius of 4. Each of the four points listed above satisfies this equation; and any other point that satisfies this equation lies on the circle drawn above. You can experiment with the position of the center and the size of the radius at the website: http://members.shaw.ca/ron.blond/TLE/QR.DRAWCIRCLE.APPLET/index.html
|
|||||||||||||||||||||||
|
|
|||||||||||||||||||||||
|
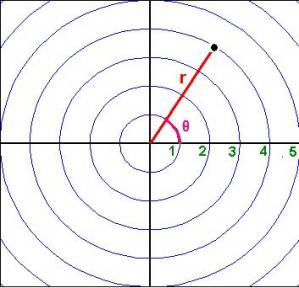
http://www.univie.ac.at/future.media/moe/galerie/zeich/zeich.html
|
|||||||||||||||||||||||
|
|
|||||||||||||||||||||||
|
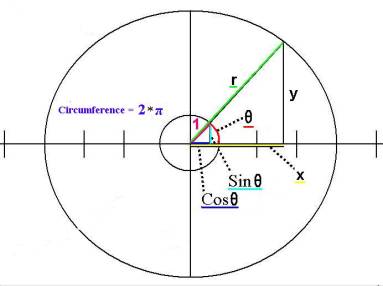
http://members.shaw.ca/ron.blond/TLE/index.html (interactive visual functions)
http://www.delta.edu/jaham/mathapplets.html (Library of applets - see trigonometry section) |
|||||||||||||||||||||||
|
|
|||||||||||||||||||||||
|
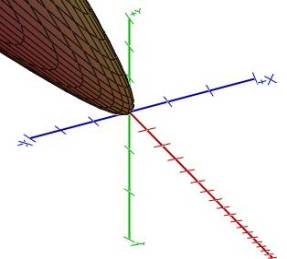
The equation above indicates how a dependent variable z depends on two independent variables x and y. The 3-D graph using three intersecting perpendicular lines corresponds to the given equation.
|
|||||||||||||||||||||||
|
|
|||||||||||||||||||||||
|
|
|||||||||||||||||||||||
|
Activities:
Explorations:
Exercises:
|
|||||||||||||||||||||||
|
Copyright © 2004 Dr. Ranel E. Erickson |