|
||||||||||||||||||||||||||||||||
|
|
||||||||||||||||||||||||||||||||
|
|
||||||||||||||||||||||||||||||||
|
Chapter 9. Graphs |
||||||||||||||||||||||||||||||||
|
|
||||||||||||||||||||||||||||||||
|
||||||||||||||||||||||||||||||||
|
|
||||||||||||||||||||||||||||||||
|
|
||||||||||||||||||||||||||||||||
|
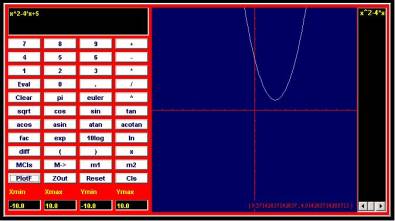
Several resources can help you to visualize the relationship between the quantities in a word problem by displaying a graph of functional expressions.
Some calculators, called graphing calculators can plot
graphs of functions. Some nice
instructions on how to use some of these graphing calculators visit the site:
http://www.prenhall.com/divisions/esm/app/calc_v2/frameset_89.html Some websites allow you to enter an expression online and will return a graph. http://www.coolmath.com/graphit/ (calculator show above) http://colbycc.edu/www/math/calculator2/calculator2.htm (alternative site with instructions)
|
||||||||||||||||||||||||||||||||
|
|
||||||||||||||||||||||||||||||||
|
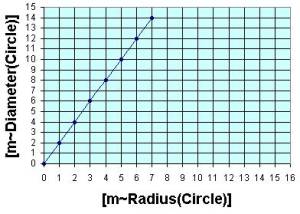
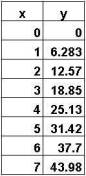
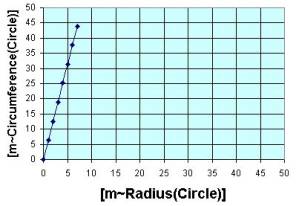
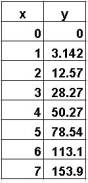
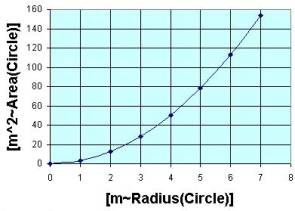
The graphs above visually show how several dimensions of a
circle depend on each other. Similarly,
you can dynamically see the relationships between dimensions associated with
an accelerating car at the site: http://www.walter-fendt.de/ph11e/acceleration.htm |
||||||||||||||||||||||||||||||||
|
|
||||||||||||||||||||||||||||||||
|
|
||||||||||||||||||||||||||||||||
|
|
||||||||||||||||||||||||||||||||
|
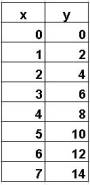
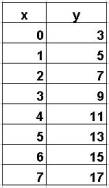
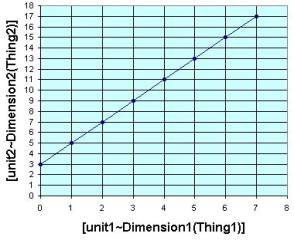
This slope-intercept form of a line has a constant "a" that determines the slope and the constant b that determines the y-intercept. In this particular example, the slope indicates that the moves 2 units up per 1 unit across and the constant b=3 determines the point (0,3) where the line crosses the y axis.
When we change a parameter like "a" or "b" it changes the graph in particular ways. You gain insight into such abstract models as you play with these parameters. Try it, visit the following websites for translations and stretching of such graphs. http://members.shaw.ca/ron.blond/TLE/Fcncd.APPLET/index.html http://members.shaw.ca/ron.blond/TLE/Fcnab.APPLET/index.html
|
||||||||||||||||||||||||||||||||
|
|
||||||||||||||||||||||||||||||||
|
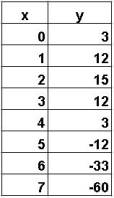
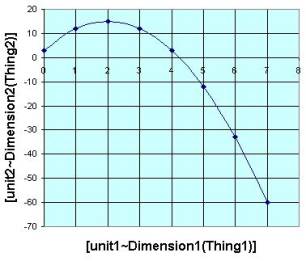
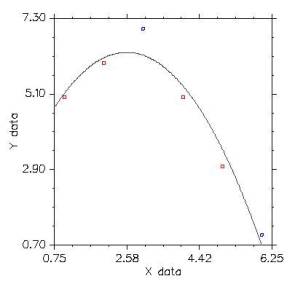
By definition, quadratic equations have an x term raised to the second power. Again, changing values of a, b, or c impacts the curve in different ways. For example, the quadratic equation forms a dome shape when the "a" parameter is negative. If you change the sign of a, the quadratic equation flips over like a hammock shape. Visit the following websites for translations and stretching of such graphs. http://members.shaw.ca/ron.blond/TLE/Fcncd.APPLET/index.html http://members.shaw.ca/ron.blond/TLE/Fcnab.APPLET/index.html
|
||||||||||||||||||||||||||||||||
|
|
||||||||||||||||||||||||||||||||
|
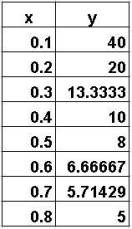
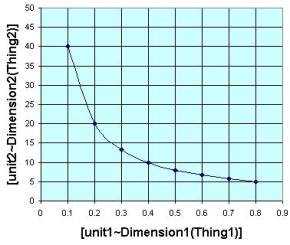
This particular form of an inverse function inverts the line function discussed previous. The example sets a=1/4 and b=0.
|
||||||||||||||||||||||||||||||||
|
|
||||||||||||||||||||||||||||||||
|
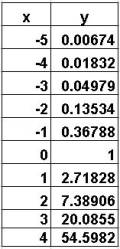
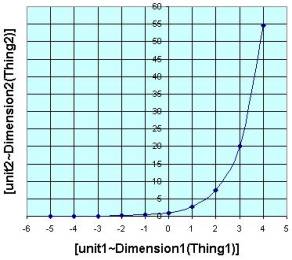
When you think of exponent, you think of the variable in the exponent; instead of x^2 we have 2^x in this case we have an exponent with base 2. The function f(x)=10^x would be an exponent function with base 10. The exponential function f(x)=e^x uses an irrational number e (approximately 2.718) as its base. This number arises naturally in real life (like π) when studying for example compounding interest or biological growth. It is the only function such that the height of the function equals the slop of a tangent line at the point on the curve. This example sets a=1 and b=1 to get the function.
|
||||||||||||||||||||||||||||||||
|
|
||||||||||||||||||||||||||||||||
|
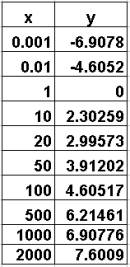
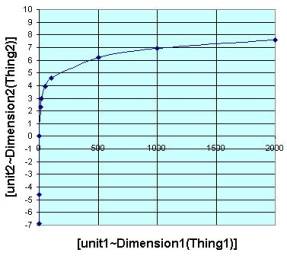
The (natural) logarithmic function y=ln(x) is the inverse the exponential function. You can visually an inverse function as a reflection of the original function around the diagonal line y=x. So ln(e^x)=x. The example sets a=0 and b=1.
|
||||||||||||||||||||||||||||||||
|
|
||||||||||||||||||||||||||||||||
|
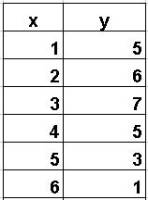
Explore linear regression by inserting points: http://www.stat.uiuc.edu/courses/stat100//java/guess//PPApplet.html
Check out the regression calculations available on line www.zunzun.com
|
||||||||||||||||||||||||||||||||
|
|
||||||||||||||||||||||||||||||||
|
|
||||||||||||||||||||||||||||||||
|
Activities:
Explorations:
Exercises:
|
||||||||||||||||||||||||||||||||
|
Copyright © 2004 Dr. Ranel E. Erickson |